Shelly PM Mini Gen 3 - Rack Power Stats
Power Consumption Graphs
Infrastructure Docs
This server is running Alma Linux built from a 'Minimal Install' to serve these web pages, I'll write up a page outlining that install later, but, after the server was presenting pages, all that needed to be installed to present this data was installing rrdtool and a font (rrdtool-1.8.0-21.el10_2.x86_64 dejavu-sans-mono-fonts-2.37-25.el10.noarch). The font was installed as a dependency automatically.
1. RRD Database Creation
The database is initialized to keep medium resolution 1-minute (60 second) steps, decaying down into historical averages for up to a year:
rrdtool create Shelly_Power.rrd \
  --step 60 \
  DS:power:GAUGE:120:U:U \
  RRA:AVERAGE:0.5:1:1440 \
  RRA:AVERAGE:0.5:5:2016 \
  RRA:AVERAGE:0.5:30:1488 \
  RRA:AVERAGE:0.5:1440:365
2. Data Collection Script (GetRackPowerInfo)
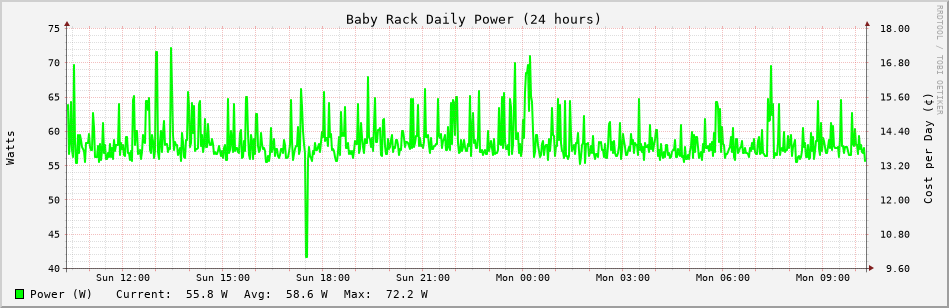
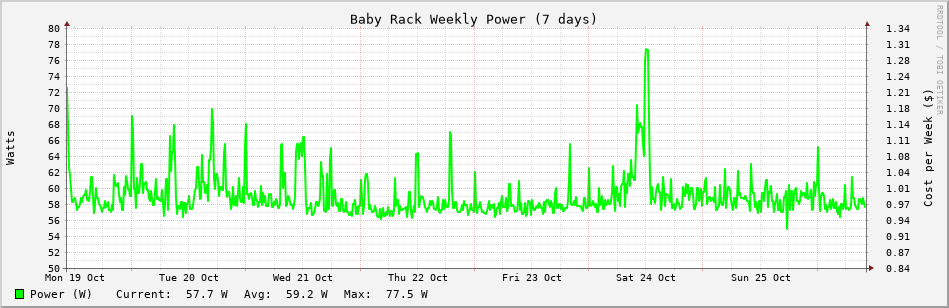
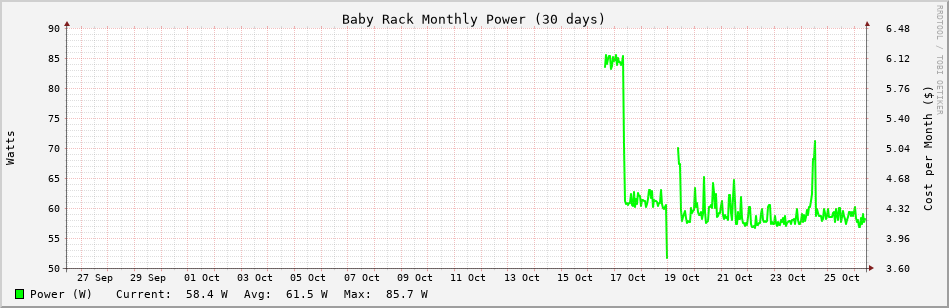
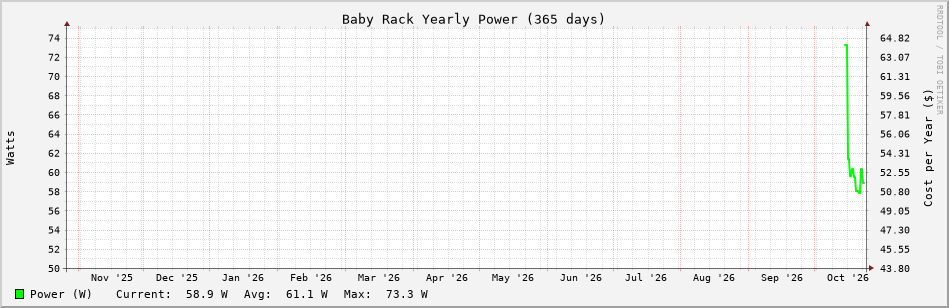
This script isolates the apower key from the pm1:0 component via local network RPC, it sets a few environment variables that are applied to the graphs, and generates the four graphs every time the script runs. An auto scaling cost axis is added to the right side of each plot.
Loading script documentation...3. Automation (cron)
Data ingestion is triggered every minute via system crontab (crontab -e):
* * * * * /Share/Media/Logs/RackPower/GetRackPowerInfo